Using Numbers to Communicate COVID-19 Risk to Patients
Note: While this section was written with COVID-19 vaccines in mind, many of the general principles apply to other vaccines as well. Individual vaccines may vary in their antigenic components or dosage forms, but the principles of human behavior and good communication skills transcend most differences between vaccines.
The Issue
Conversations about COVID-19 vaccines (and any vaccine) should include discussions of personal risk and vaccine effectiveness. Many people have difficulty interpreting and applying health-related data, especially if they have low numeracy skills or do not see themselves at risk. Pharmacists should be aware of and sensitive to the ways in which quantitative data may be misunderstood or misinterpreted.
What We Know
COVID-19 vaccines protect people from getting seriously ill, being hospitalized, and dying. The Centers for Disease Control and Prevention (CDC) issues recommendations to help people optimize their immunity against COVID-19.
As of summer 2024, only a small proportion of Americans had received the recommended vaccination. One strategy for improving COVID-19 vaccine uptake is to share quantitative data about COVID-19 disease risk and vaccine effectiveness. How those data are shared can make a big difference. Let’s face it, making sense of statistics is hard for a lot of people.
Risk Reduction: Relative vs. Absolute
News reports often describe the percent reduction in disease burden as a way of showing how well a vaccine works, like 50%, 75%, or 90%. Frequently, they report a relative reduction in risk, which tends to be a larger and more impressive number than the same effect described as an absolute reduction in risk.
Clinical trials for COVID-19 vaccines reported impressive efficacy in preventing symptomatic disease: 95% relative risk reduction for Pfizer-BioNTech’s vaccine and 94% for Moderna’s vaccine. But these values did not mean that 94% to 95% of people were protected from disease with these vaccines—a common misconception among patients and even some health care professionals.1 It means that the number of cases of COVID-19 disease would be reduced by 94% to 95% from what would happen without vaccination.
Applying Data
Let's say a group was of the size that 100 COVID-19 cases would occur—vaccination would reduce the toll to 5 or 6 cases instead of 100.
If you calculated the absolute risk reduction in the same clinical trial population, the absolute risk reduction provided by the vaccines might seem less impressive: 0.84% for Pfizer-BioNTech’s vaccine (0.88% in the placebo group minus 0.04% in the vaccinated group) and 1.23% for Moderna’s vaccine (1.31% minus 0.08%).2 Unfortunately, vaccine skeptics seized on these absolute values as “proof” that the vaccines were not very effective and that the real rate of protection was much lower than authorities were claiming.2 Both sets of numbers shown above are real and accurate, it’s just that the big impressive numbers are measures of relative risk reduction, while the smaller numbers are measures of absolute risk reduction.
To give patients a complete picture and to be transparent, try giving them both sets of numbers. Say something like this:
“The updated COVID-19 vaccine reduces the risk of hospitalization by 59% [relative risk reduction]. So, the disease is happening at the rate of 11 cases per 100 people. With a reduction in risk of 59%, there would be 5 cases instead of 11 cases of people hospitalized [absolute risk reduction].”
Show Your Math: Background
Event rates in populations (i.e., the number of people experiencing an event as a proportion of the number of people in the population) can be compared in two main ways. Absolute risk reduction is the arithmetic difference between two event rates.3 Relative risk reduction is the difference in event rates expressed in a proportional or relative manner in relation to the control event rate.3
If X is the rate of COVID-19 disease cases in a vaccinated population (number of cases/total population) per month and Y is the rate of COVID-19 disease cases in an unvaccinated population per month:
Then the absolute risk reduction is Y – X, or 5 instead of 11 cases, in the example above.
And the relative risk reduction is [Y – X]/Y (often shown as a percentage). For the example above, this would be (11 minus 5) divided by 11 = 59% (more or less, depending on number of decimal places).
Absolute risk reduction is sensitive to the background risk. Holding relative risk reduction values steady, absolute risk reduction values will be higher when the infection rate is higher. In other words, absolute risk reduction values will seem higher for more frequent diseases than they will for rare diseases.2,3
Guidelines for evidence-based risk communication recommend providing both absolute risk reduction and relative risk reduction data in assessments of treatment or vaccine efficacy.4 Relative risk reduction often is larger and more impressive than absolute risk reduction; both patients and health care professionals view interventions more favorably when information is presented in this format. Omitting information about absolute risk reduction can be considered a form of outcome reporting bias.2,5
A = Vaccinated population
B = Unvaccinated population
Relative Risk Example
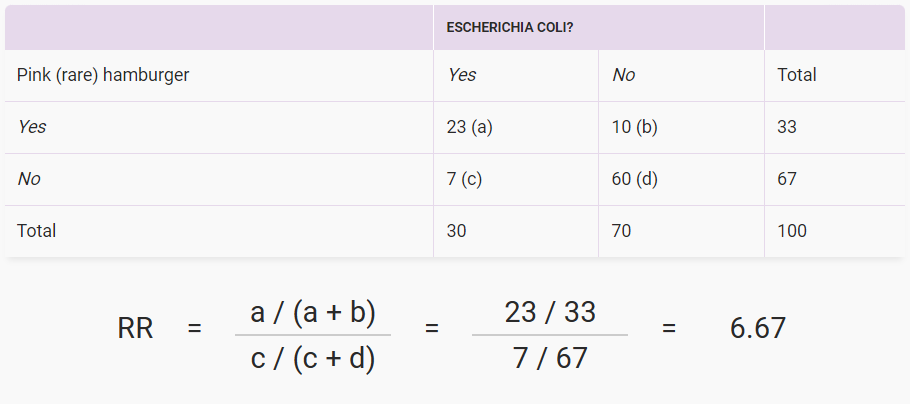
In the example above, people who ate undercooked hamburgers were 6.67 times more likely to develop an E. coli infection than those whose hamburgers were not pink when they ate them. Mathematically, the relative risk (RR) was 6.67 for this picnic. You can see from the cells that some people who ate undercooked hamburgers did just fine, and some well-done burger eaters got E. coli infection anyway, maybe from something else they ate.
Key Points
1. Relative reductions in risk (e.g., 95% fewer infections) seem more impressive than absolute reductions in risk (e.g., the infection rate fell by 0.84%), even when they are mathematically equivalent.
2. To be transparent, use both approaches. Example: Among a group of vaccinated people, vaccination reduced infections by 60%, so there were 4 infections instead of the 10 infections expected in unvaccinated people [ (10 – 4 ) ¸ 10 = 60%].
- Relative risk reduction: 60%. Absolute risk reduction: 6 (i.e., 4 rather than 10).
3. Ratio bias: People may believe 20 in 100 is more likely than 2 in 10, despite being equivalent. In this case, people are more focused on the numerator than the denominator.
4. Frequencies (1 in X):
- People may believe 1 in 200 is more likely than 5 in 1,000 for reasons unknown.
- Try to avoid two 1 in X values, as some people mistakenly believe (for example) that 1 in 60 is riskier than 1 in 40.
- People may find 1 in 1,000 easier to interpret than 0.1%. Decimals are hard for many people to comprehend.
5. Gains or Losses: With vaccination, it is unclear whether gain framing seems more desirable than loss framing. Try both:
- Gain Framing: Vaccination reduced the risk of infection and hospitalization by X%. Alternately, vaccination improved chances of staying out of the hospital by X%.
- Loss Framing: Compared to vaccinated people, unvaccinated people were X% more likely to be infected and hospitalized.
6. Always check for individual understanding.
Interpretation of Natural Frequency vs. Percentages
Here’s another example of how data presentation affects people’s perceptions, using actual data from an early analysis of bivalent mRNA vaccine effectiveness in preventing COVID-19–associated emergency department or urgent care encounters and hospitalizations among immunocompetent adults6:
- 11% of unvaccinated people were hospitalized due to COVID-19 disease, compared with 6% of people who had received a bivalent booster vaccine.
- About 11 in 100 unvaccinated people were hospitalized due to COVID-19 disease, compared with 6 in 100 people who had received a bivalent booster vaccine.
- About 1 in 9 unvaccinated people were hospitalized due to COVID-19 disease, compared with 1 in 16 people who had received a bivalent booster vaccine.
Each sentence conveys the same information about the likelihood of being hospitalized due to COVID-19 disease. And each illustrates potential benefits and drawbacks to how information is conveyed.
Ratio bias is the tendency for people to judge a low probability event as more likely when presented as a ratio of larger numbers (e.g., 20 in 100) than smaller numbers (e.g., 2 in 10).7,8 For example, Yamagishi showed that participants rated cancer as riskier when it was described as “kills 1,286 out of 10,000 people” (12.86% mortality) than when it was described as “kills 24.14 out of 100 people” (24.14% mortality).9
In a classic experiment, participants could try to draw a winning red jellybean from a jar that contained 100 jellybeans (10 red and 90 white) or a jar that contained 10 jellybeans (1 red and 9 white).10 A significantly larger percentage (76.9%) chose the large bowl, despite the equivalent odds of winning.10
Ratio bias is attributed to the tendency to focus on the numerator of the ratio, rather than the overall proportion.7,8 The larger numerator in “20 in 100” makes that event seem more likely than “2 in 10.” Participants in the jellybean study who chose the large bowl reported feeling more of a chance of winning because there were more red jellybeans in the bowl.
The 1 in X format is an interesting exception. Pighin et al. found that a ratio with 1 as the numerator (e.g., 1 in 200) was subjectively perceived as “bigger and more alarming” than an equivalent ratio with a different numerator (e.g., 5 in 1,000).11 This “1-in-X effect” applies to multiple populations, probabilities, and medical conditions. People have a harder time comparing ratios with a fixed numerator but different denominators (e.g., 1 in 27 vs. 1 in 80), in part because a larger denominator is associated with smaller probability/lower risk.12,13 Experts increasingly recommend avoiding the 1 in X format whenever possible.13
It is unclear whether percentage formats or frequency formats are preferable. There is some evidence that comprehension may be higher when data are presented as percentages rather than frequency ratios, possibly because of the more succinct format.14,15 However, there also is evidence that people find percentages less than 1% (e.g., 0.1%) more difficult to understand than the equivalent frequency (e.g., 1 in 1,000).15 This may have more to do with difficulty manipulating decimal points than with comprehension per se.
Gain and Loss Framing
Probabilities and the relationships between them can be framed as a gain (e.g., longer survival, more benefits ) or a loss (e.g., shorter life, costs).12 The framing effect is a type of cognitive bias that occurs when different descriptions of the same problem or outcome lead to different responses.16 In a seminal study by McNeil et al., participants (patients, graduate students, and physicians) were asked to choose between surgery and radiation therapy for operable lung cancer based on simple descriptions of the possible consequences. If participants were told they had a 90% probability of surviving the perioperative period (gain frame), they chose surgery 42% of the time. But if participants were told they had a 10% probability of dying during the perioperative period (loss frame), they chose surgery only 25% of the time. The authors speculated that the risk of perioperative death loomed larger when presented in terms of mortality than in terms of survival.17
In general, gain-framed messages that emphasize the desirable and pleasant consequences of complying with a recommended behavior are more effective when the target behavior is prevention (e.g., regular physical exercise) or in situations where the outcomes are certain (e.g., using car seats decreases child injuries and deaths).4 Loss-framed messages that emphasize the unpleasant consequences or disadvantages of not complying with a recommended behavior are more effective in settings of uncertainty and risky outcomes (e.g., whether a mammogram will result in a cancer diagnosis).4
The existing literature does not clearly support either gain-framed or loss-framed messages as more effective for promoting COVID-19 vaccine acceptance.18,19 Experts recommend describing the benefits and risks using both frames whenever possible.12 For example:
“The COVID-19 vaccine cut the risk of being hospitalized due to COVID-19 disease by more than half. Compared with people who had received a vaccine, unvaccinated persons were more than twice as likely to be hospitalized due to COVID-19 disease.”
Use of Visual Aids
Guidelines for evidence-based risk communication recommend using graphs or other visual aids (e.g., pictograms) to make numeric information easier to understand.12 One novel patient-directed option is the interactive online tool that allows users to adjust age, vaccine status, and health background to predict the risks of illness from the virus and COVID-19 vaccination compared with familiar existing risks (e.g., dying in a car crash, being struck by lightning). Results are displayed as a bar graph, allowing easy visualization of the different risk levels.
References
- Olliaro P. What does 95% COVID-19 vaccine efficacy really mean? Lancet Infect Dis. 2021;21(6):769. doi: 10.1016/S1473-3099(21)00075-X
- Olliaro P, Torreele E, Vaillant M. COVID-19 vaccine efficacy and effectiveness—the elephant (not) in the room. Lancet Microbe. 2021;2(7):e279–e280. doi: 10.1016/S2666-5247(21)00069-0. Erratum in: Lancet Microbe. 2021;2(7):e288. doi: 10.1016/S2666-5247(21)00152-X
- Barratt A, Wyer PC, Hatala R, et al. Tips for learners of evidence-based medicine: 1. Relative risk reduction, absolute risk reduction and number needed to treat. CMAJ. 2004;171(4):353–358. doi: 10.1503/cmaj.1021197
- Fischhoff B, Brewer NT, Downs JS, eds. Communicating Risks and Benefits: An Evidence-Based User’s Guide. U.S. Department of Health and Human Services, Food and Drug Administration; August 2011. Accessed August 1, 2023. https://www.fda.gov/about-fda/reports/communicating-risks-and-benefits-evidence-based-users-guide
- Brown RB. Outcome reporting bias in COVID-19 mRNA vaccine clinical trials. Medicina. 2021;57(3):199. doi: 10.3390/medicina57030199
- Tenforde MW, Weber ZA, Natarajan K, et al. Early estimates of bivalent mRNA vaccine effectiveness in preventing COVID-19–associated emergency department or urgent care encounters and hospitalizations among immunocompetent adults—VISION Network, nine states, September–November 2022. MMWR Morb Mortal Wkly Rep. 2023;71(53):1637–1646. doi: 10.15585/mmwr.mm7153a1
- Denes-Raj V, Epstein S, Cole J. The generality of the ratio-bias phenomenon. Pers Soc Psychol Bull. 1995;21(10):1083–1092. doi: 10.1177/01461672952110009
- Bonner C, Newell B. How to make a risk seem riskier: the ratio bias versus construal level theory. Judgm Decis Mak. 2008;3(5):411–416. doi: 10.1017/S1930297500000437
- Yamagishi K. When a 12.86% mortality is more dangerous than 24.14%: implications for risk communication. Appl Cognit Psychol. 1997;11(6):495–506. doi: 10.1002/(SICI)1099-0720(199712)11:6<495::AID-ACP481>3.0.CO;2-J
- Kirkpatrick LA, Epstein S. Cognitive-experiential self-theory and subjective probability: further evidence for two conceptual systems. J Pers Soc Psychol. 1992;63(4):534–544. doi: 10.1037//0022-3514.63.4.534
- Pighin S, Savadori L, Barilli E, et al. The 1-in-X effect on the subjective assessment of medical probabilities. Med Decis Making. 2011;31(5):721–729. doi: 10.1177/0272989X11403490
- Ancker JS, Benda NC, Sharma MM, et al. Taxonomies for synthesizing the evidence on communicating numbers in health: goals, format, and structure. Risk Anal. 2022;42(12):2656–2670. doi: 10.1111/risa.13875
- Suk K, Hwang S, Jeong Y. The 1-in-X effect in perceptions of risk likelihood differences. Organ Behav Hum Decis Process. 2022;170:104131. doi: 10.1016/j.obhdp.2022.104131
- Woloshin S, Schwartz LM. Communicating data about the benefits and harms of treatment: a randomized trial. Ann Intern Med. 2011;155(2):87–96. doi: 10.7326/0003-4819-155-2-201107190-00004
- Bonner C, Trevena LJ, Gaissmaier W, et al. Current best practice for presenting probabilities in patient decision aids: fundamental principles. Med Decis Making. 2021;41(7):821–833. doi: 10.1177/0272989X21996328
- Tversky A, Kahneman D. The framing of decisions and the psychology of choice. Science. 1981;211(4481):453–458. doi: 10.1126/science.7455683
- McNeil BJ, Pauker SG, Sox HC Jr, et al. On the elicitation of preferences for alternative therapies. N Engl J Med. 1982;306(21):1259–1262. doi: 10.1056/NEJM198205273062103
- Xia S, Nan X. Motivating COVID-19 vaccination through persuasive communication: a systematic review of randomized controlled trials. Health Commun. 2023;(May):1–24. doi: 10.1080/10410236.2023.2218145
- Penţa MA, Băban A. Message framing in vaccine communication: a systematic review of published literature. Health Commun. 2018;33(3):299–314. doi: 10.1080/10410236.2016.1266574
Return to Playbook Topics
View in Spanish